Product
See the whole request, service by service
Full OpenTelemetry span fidelity — kind, status, events, links, and attributes — reconstructed into a waterfall you can actually read.
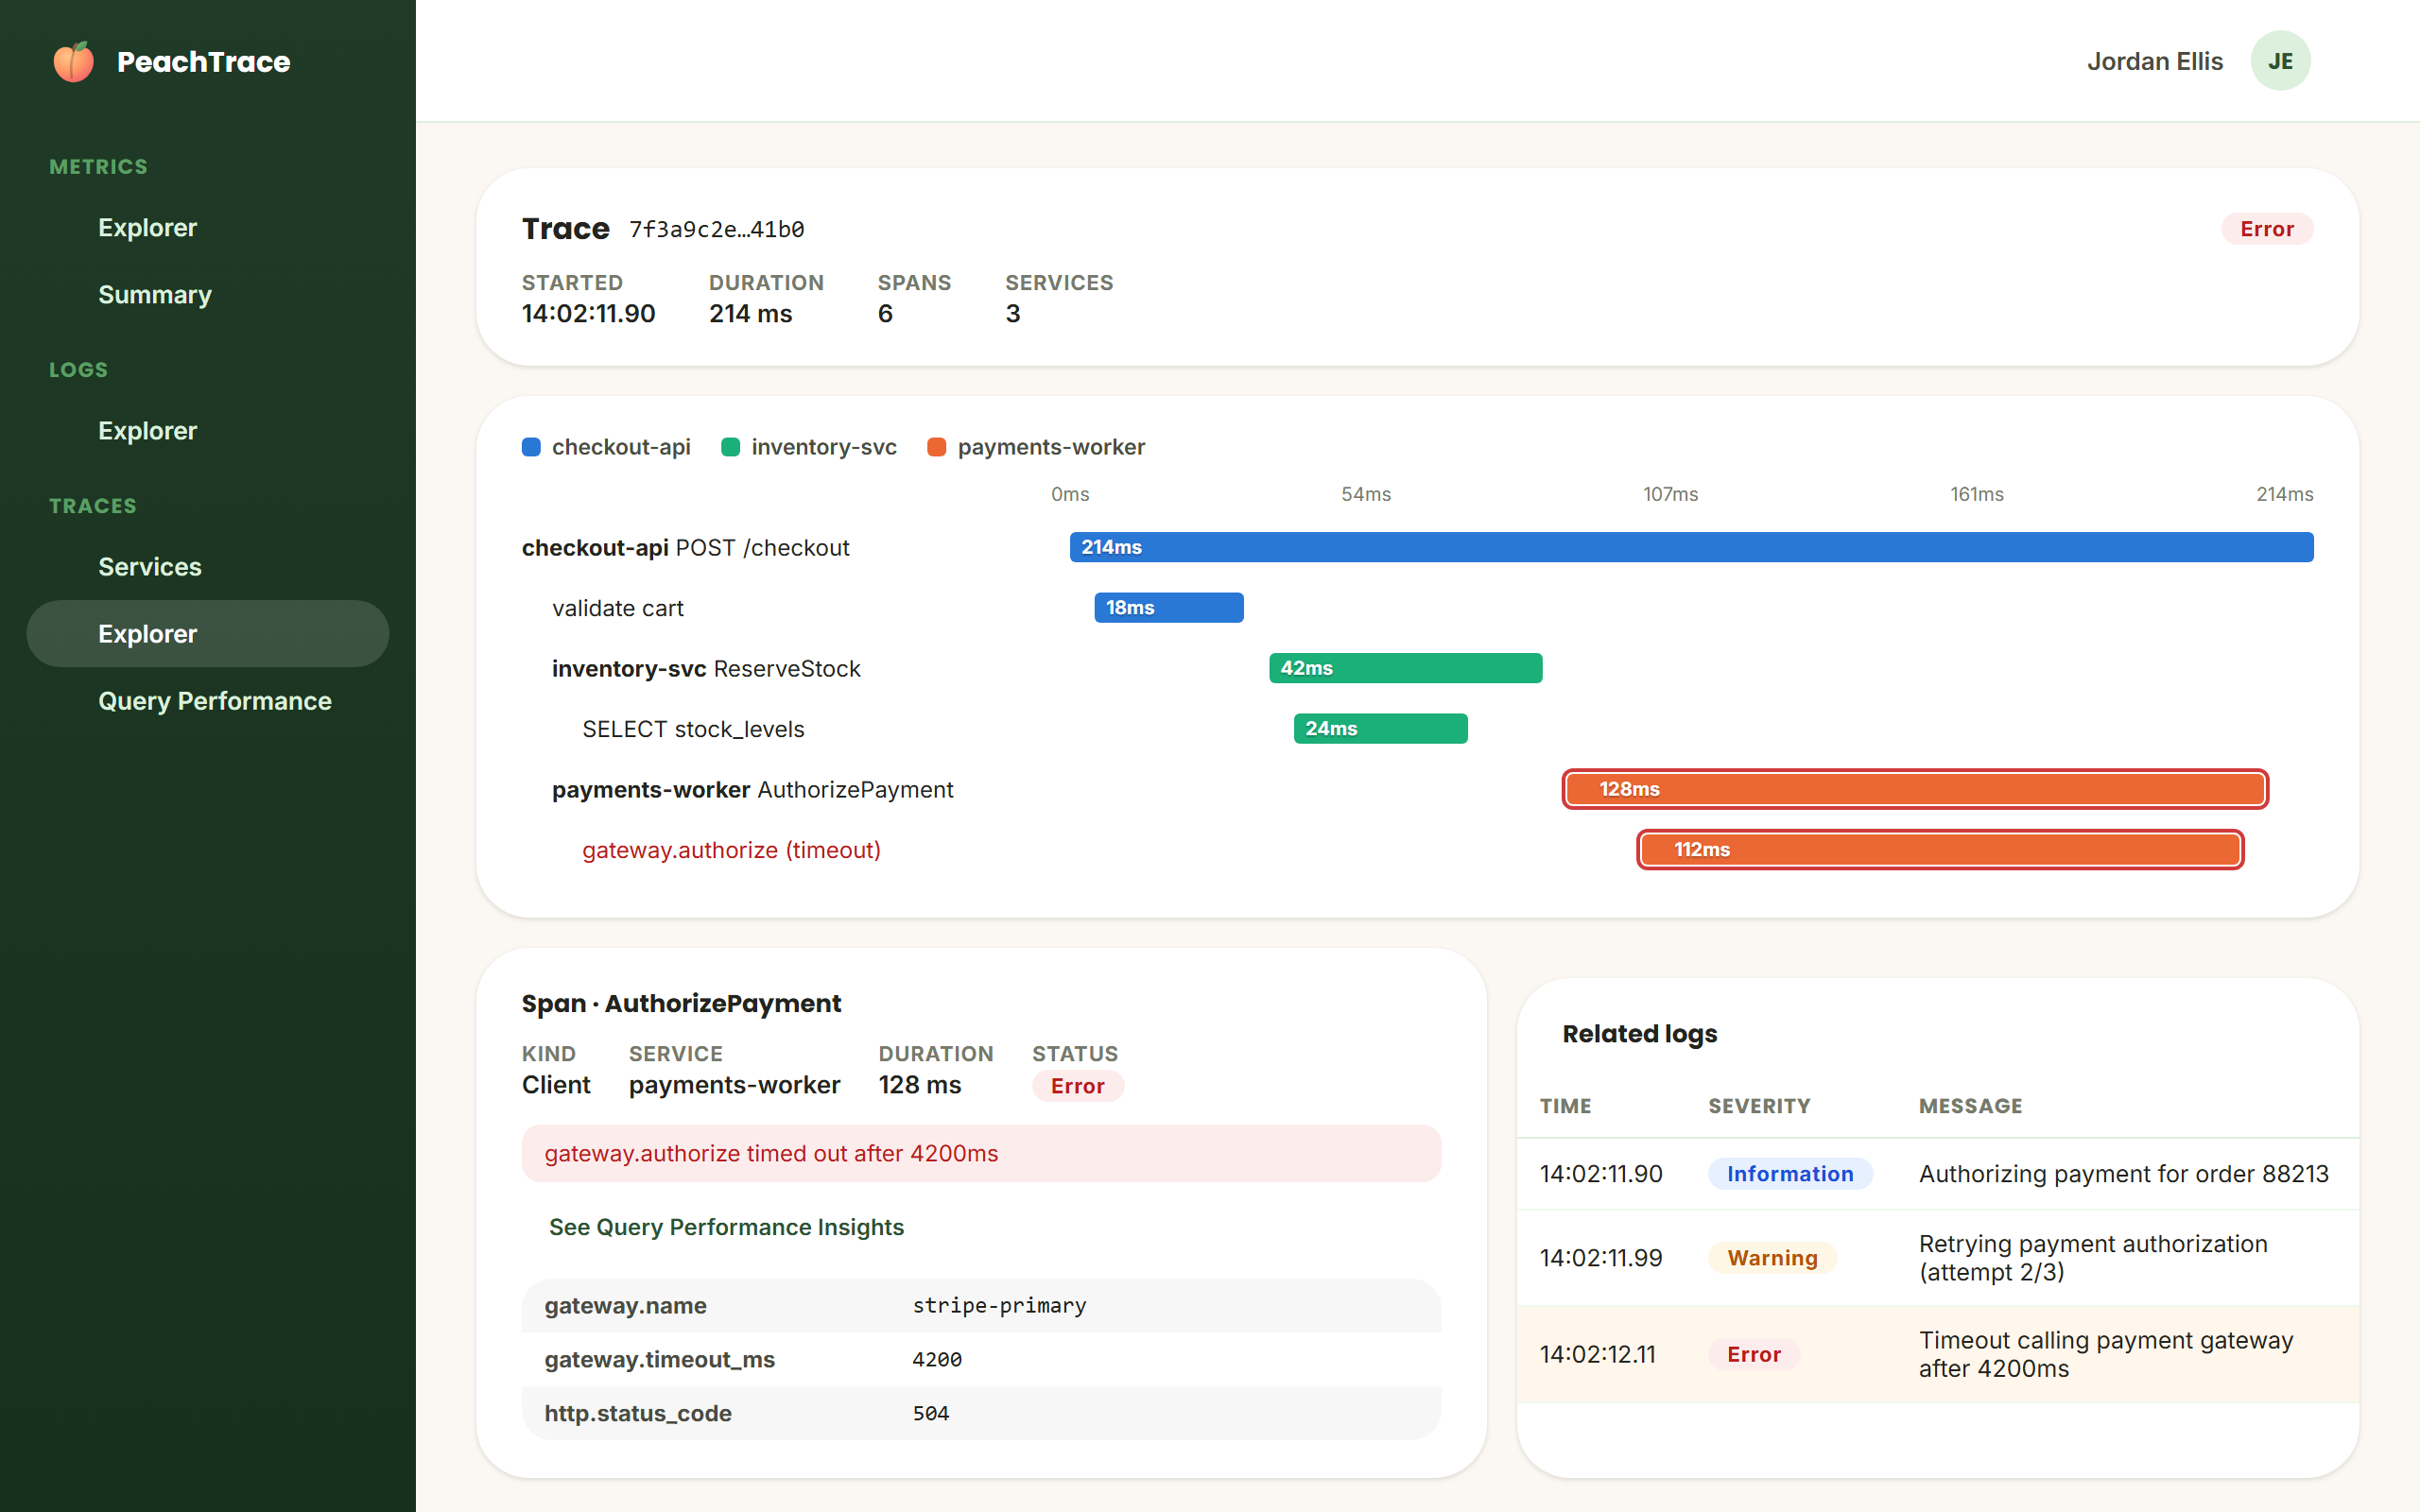
Service list and trace waterfall
Start from a list of services and their recent traces, or drop directly into a waterfall view of a single trace — parent/child spans, timing, status codes, and span kind, all reconstructed from the raw OTel span model PeachTrace stores.
Live Tail
Watch traces arrive in real time as your services handle traffic, streamed over server-sent events with the same resumable-cursor model as Live Tail for logs.
From a slow span to the reason it was slow
And if the slow span is a database call, it doesn’t stop there. Spans tagged with OpenTelemetry’s database semantic conventions feed directly into Query Performance Insights — PeachTrace’s slow-query analyzer built entirely from your trace data.
Join the PeachTrace limited beta
We're onboarding a limited number of teams. Tell us about your environment and we'll get you set up.
Join the Beta