Product
Find your slowest queries without installing another agent
PeachTrace mines the database spans your OpenTelemetry SDK is already emitting and turns them into a full slow-query analyzer — automatically.
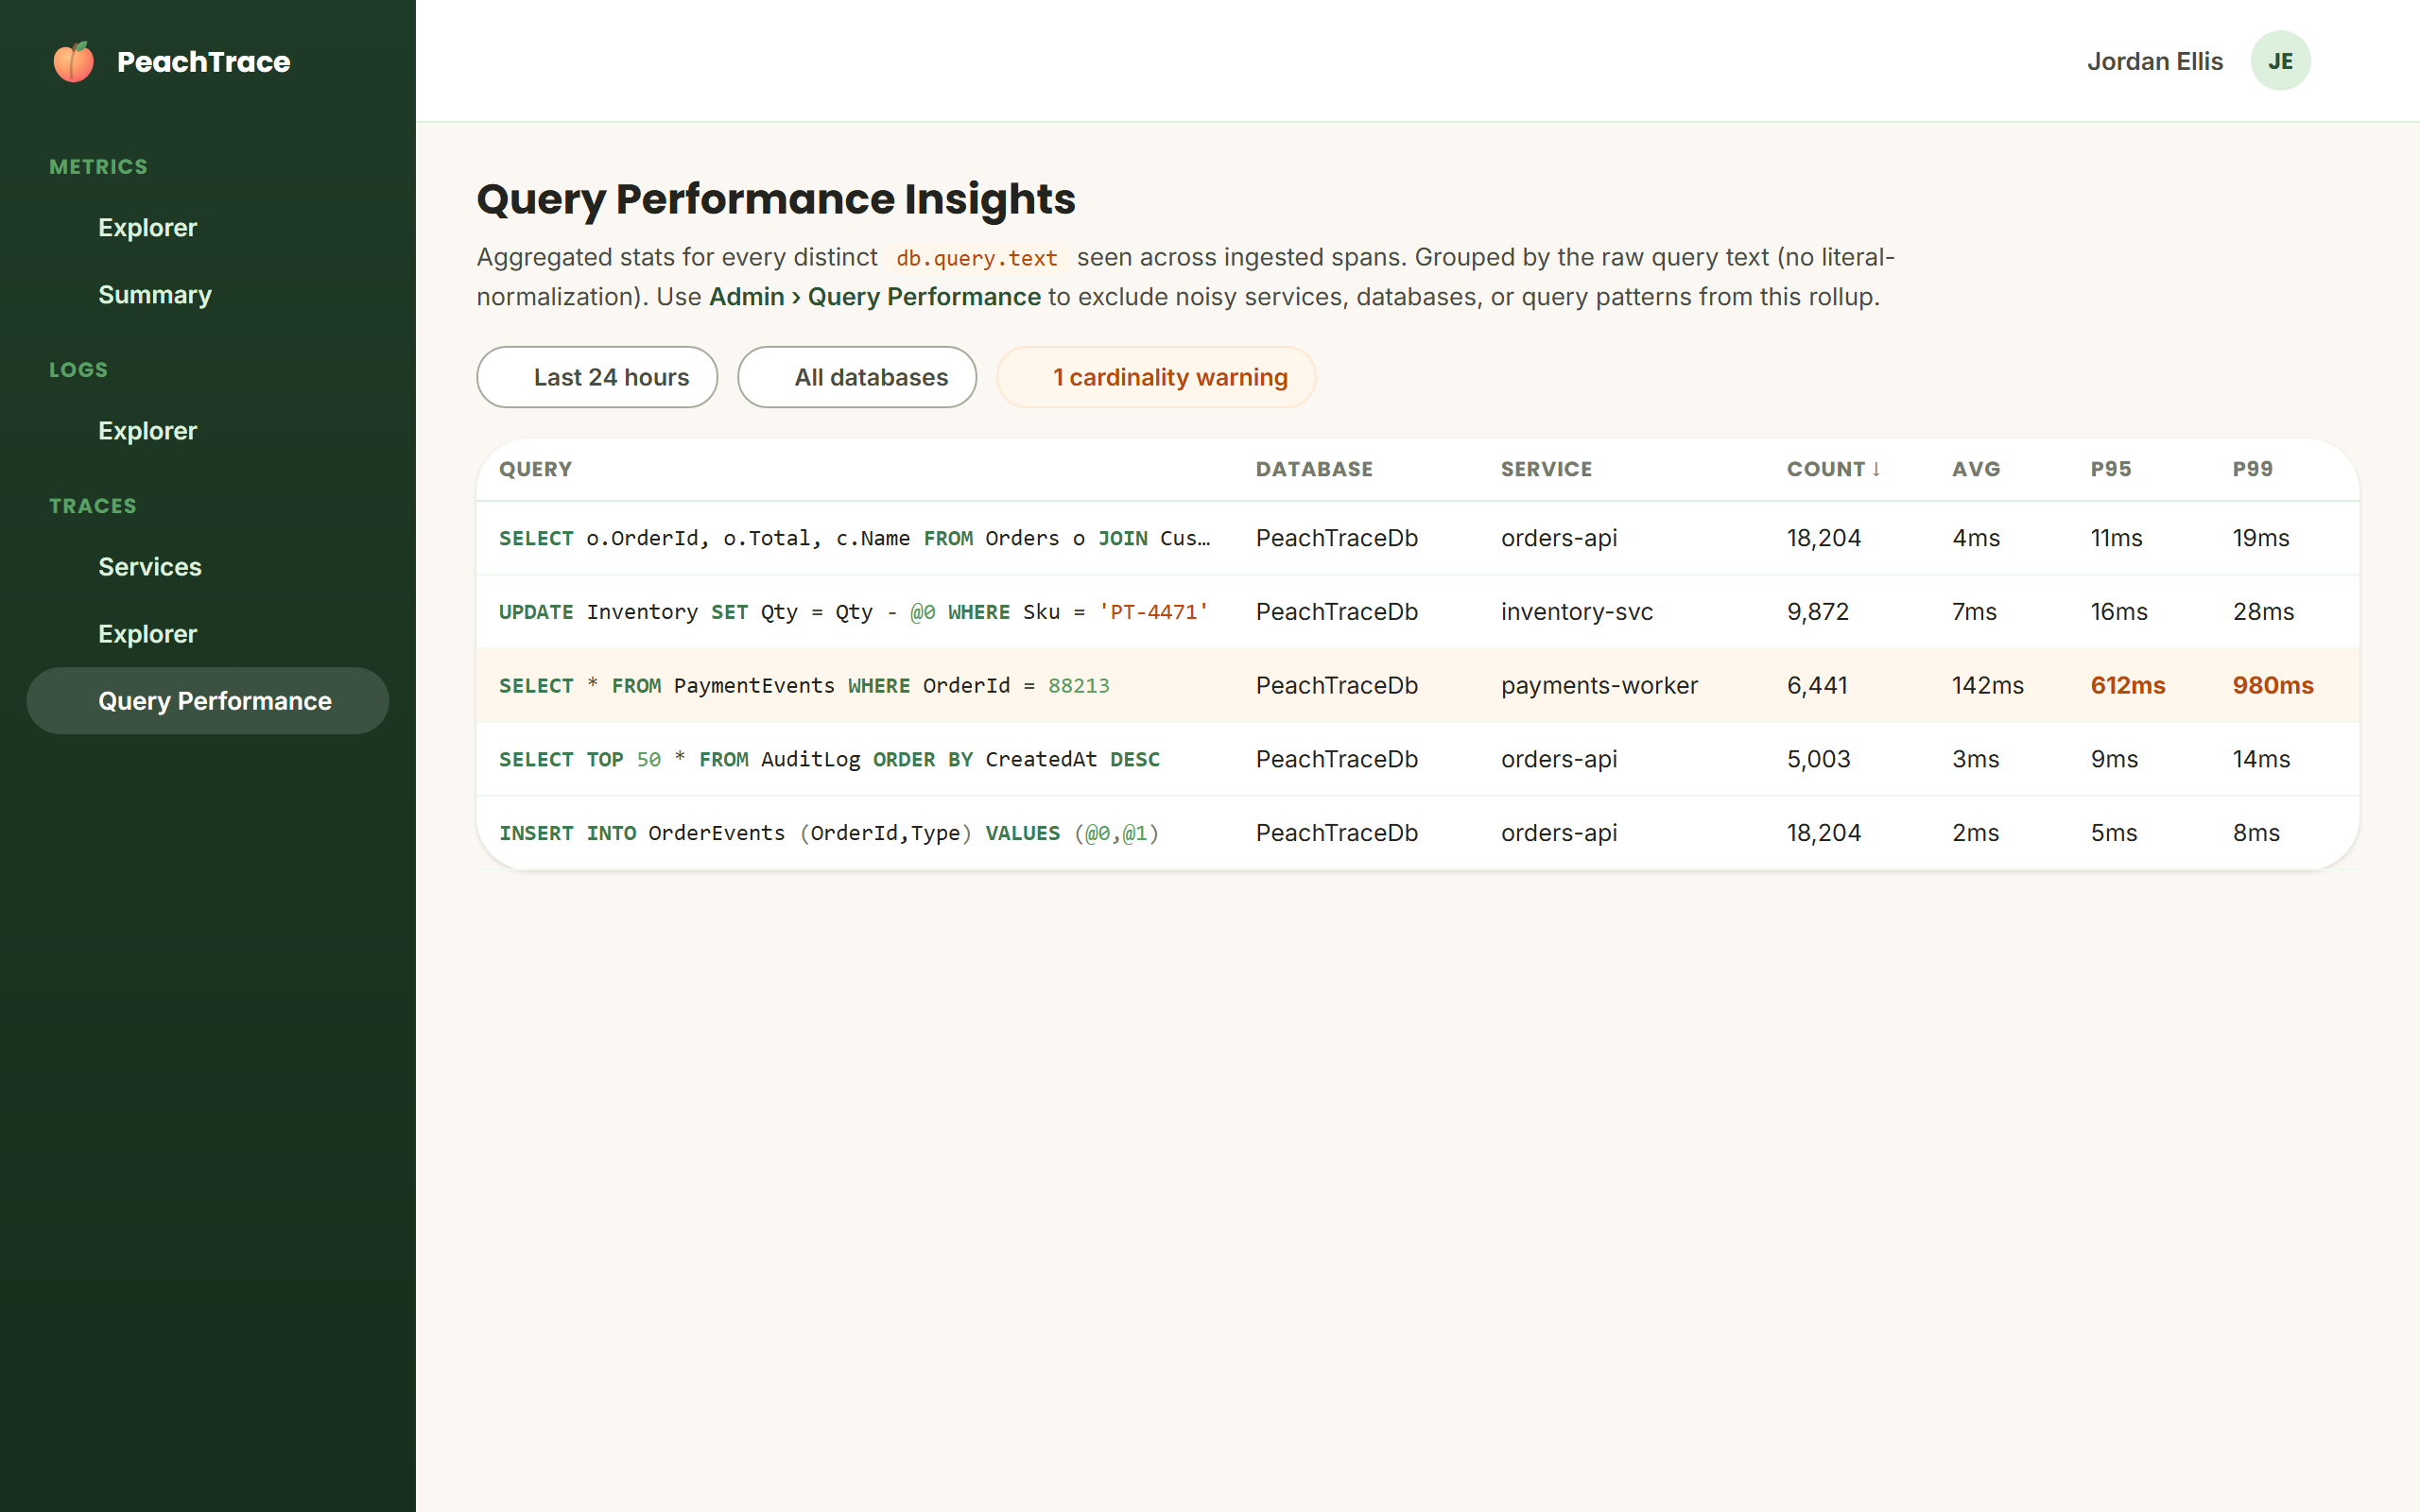
Built from spans you’re already producing
If your services are instrumented with OpenTelemetry’s database semantic conventions (db.query.text, db.system, and related attributes — which most database client instrumentation emits by default), PeachTrace is already watching. There’s no separate database monitoring agent to install, no extra credentials to hand out, and nothing new to instrument — Query Performance Insights is built entirely from spans your services are already sending.
Per-query rollups
PeachTrace groups spans by service, query text, and time bucket, and rolls each group up into:
- Execution count, and total, minimum, and maximum duration
- p95 and p99 latency, interpolated from a 40-bucket log-scale duration histogram — accurate percentile estimation without storing every individual execution
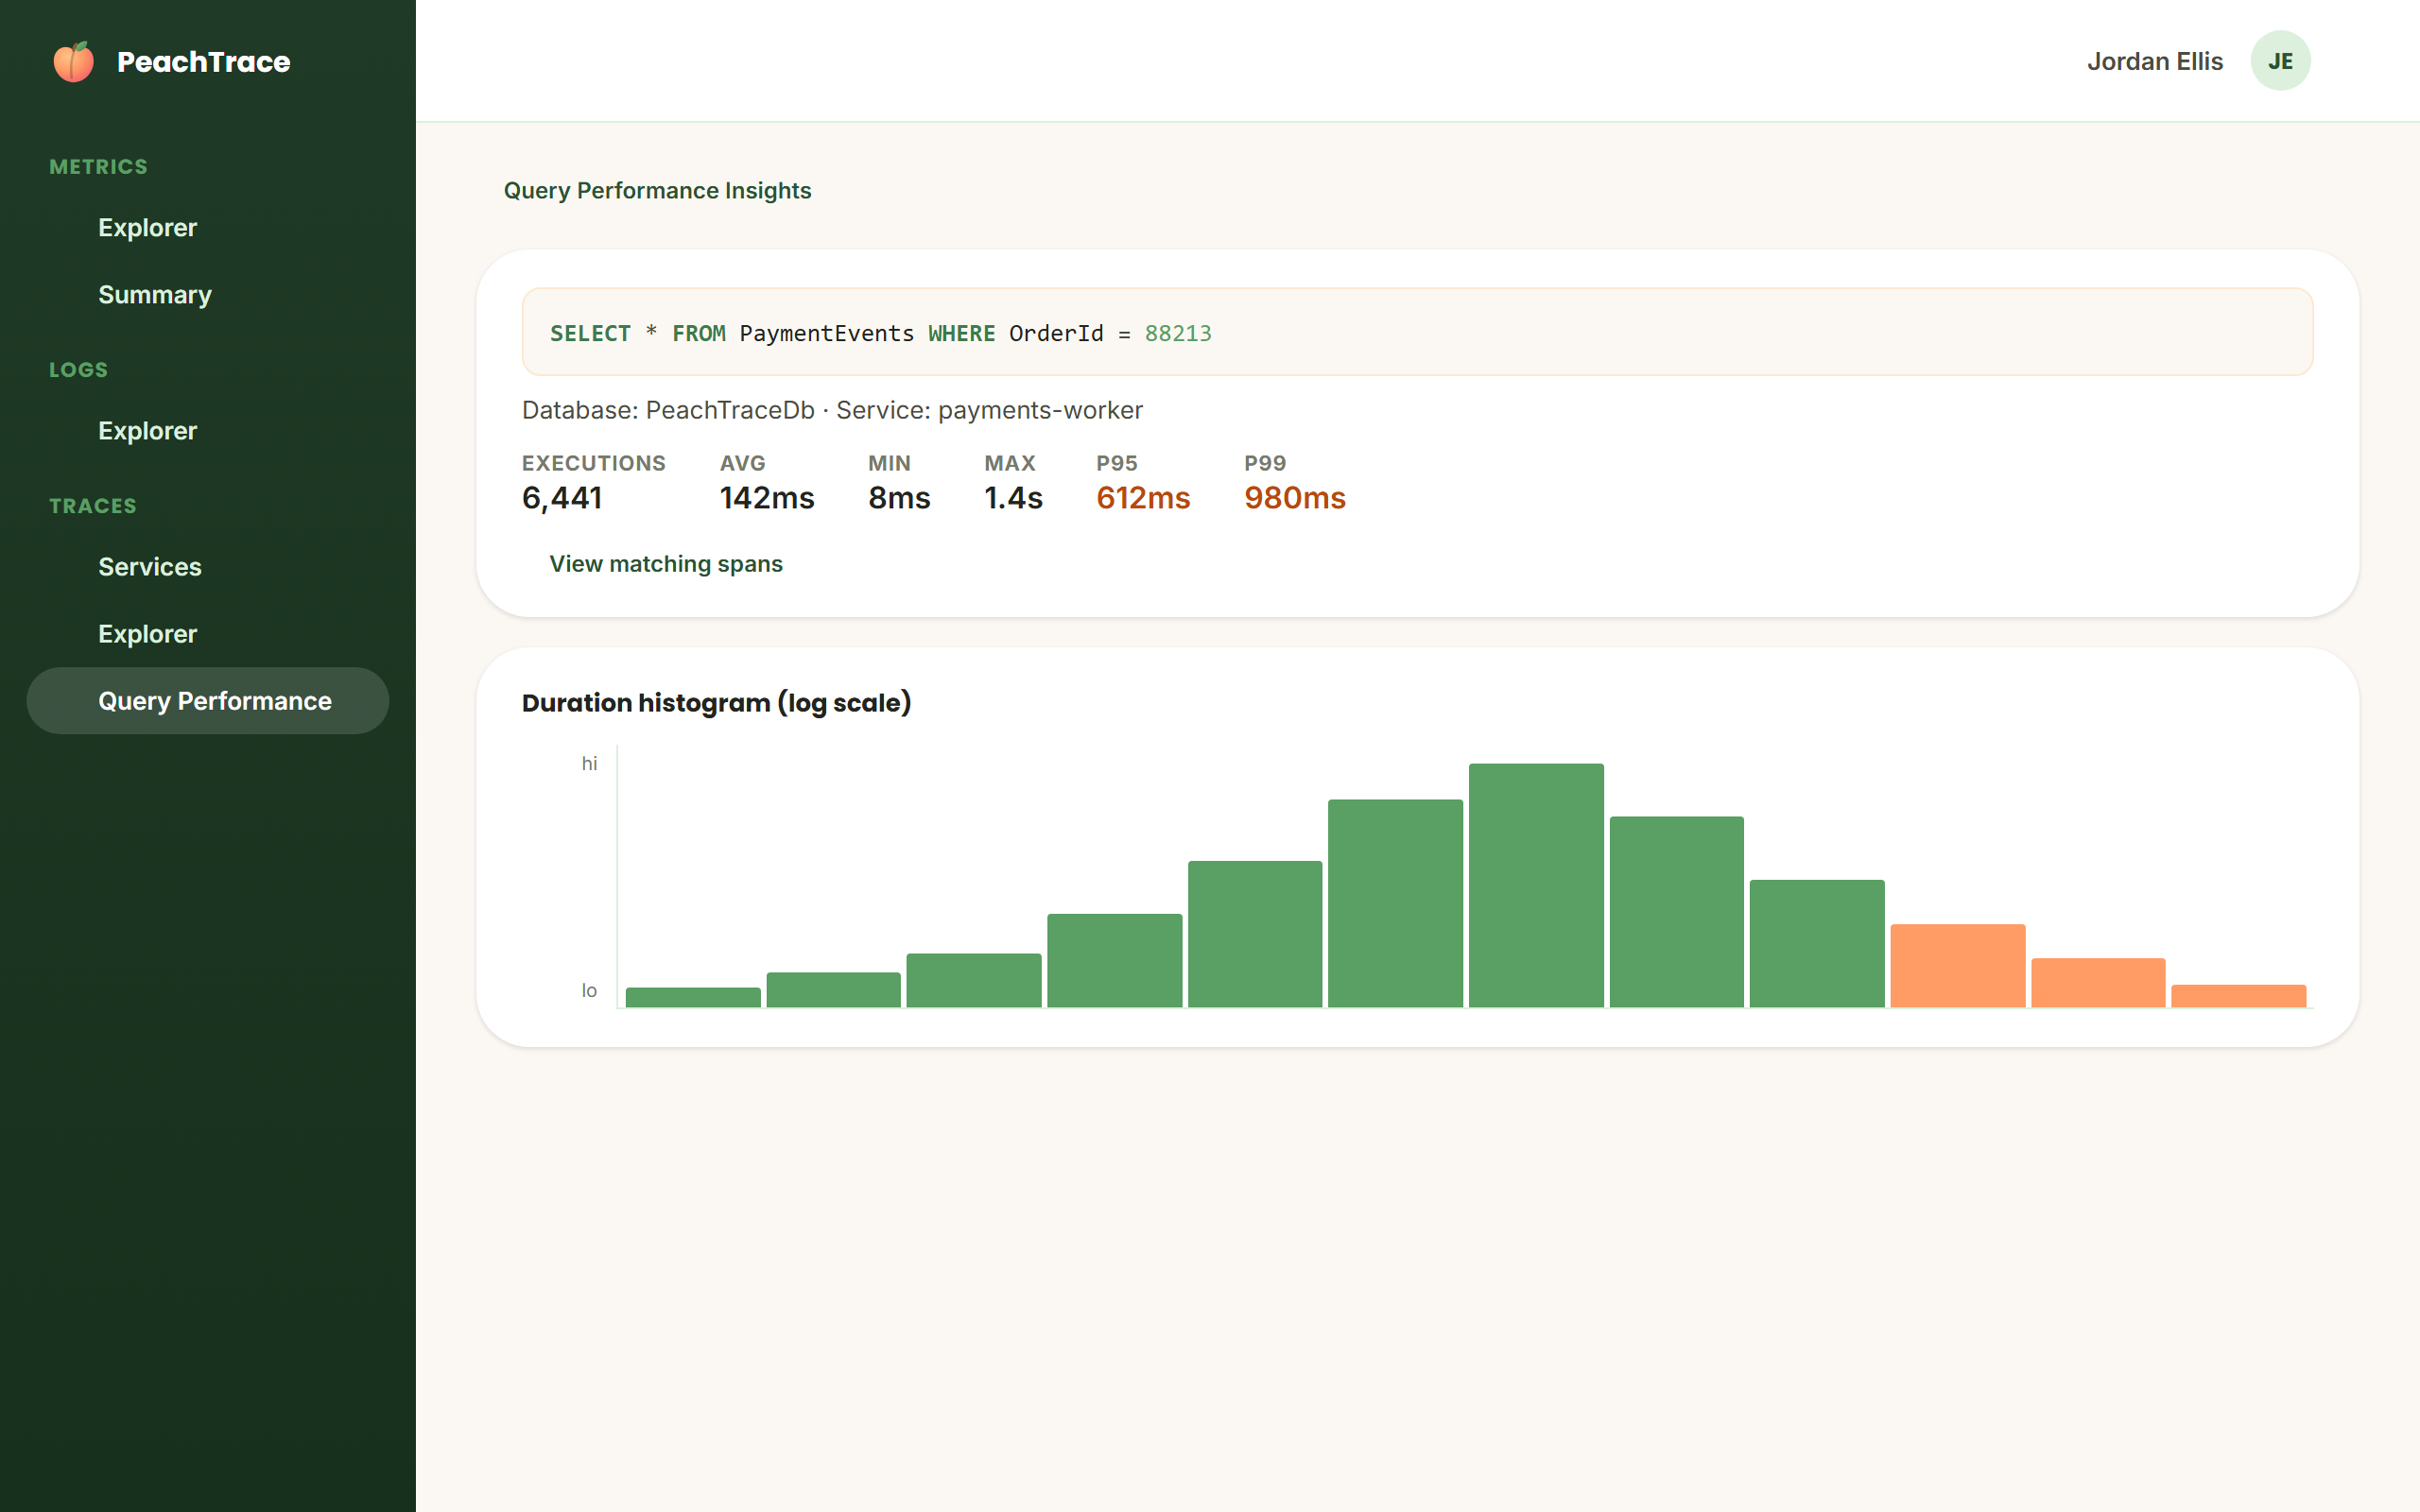
Built to stay useful at scale
Real applications sometimes emit unparameterized SQL — literal values inline instead of parameters — which can otherwise explode the number of “distinct” queries being tracked. PeachTrace guards against that automatically:
- Cardinality protection caps the number of distinct query shapes tracked per service, per time bucket, and flags the services generating unusually high query-text cardinality so you know exactly where to fix parameterization.
- Exclusion rules let admins filter out noisy or irrelevant queries by service, database namespace, or server address — or by regular expression, matched safely with no catastrophic-backtracking risk.
From slow query back to the full story
Join the PeachTrace limited beta
We're onboarding a limited number of teams. Tell us about your environment and we'll get you set up.
Join the Beta