Product
Logs that already know which trace they belong to
Every log record PeachTrace stores carries its trace_id and span_id — so you're never stuck matching timestamps by hand.
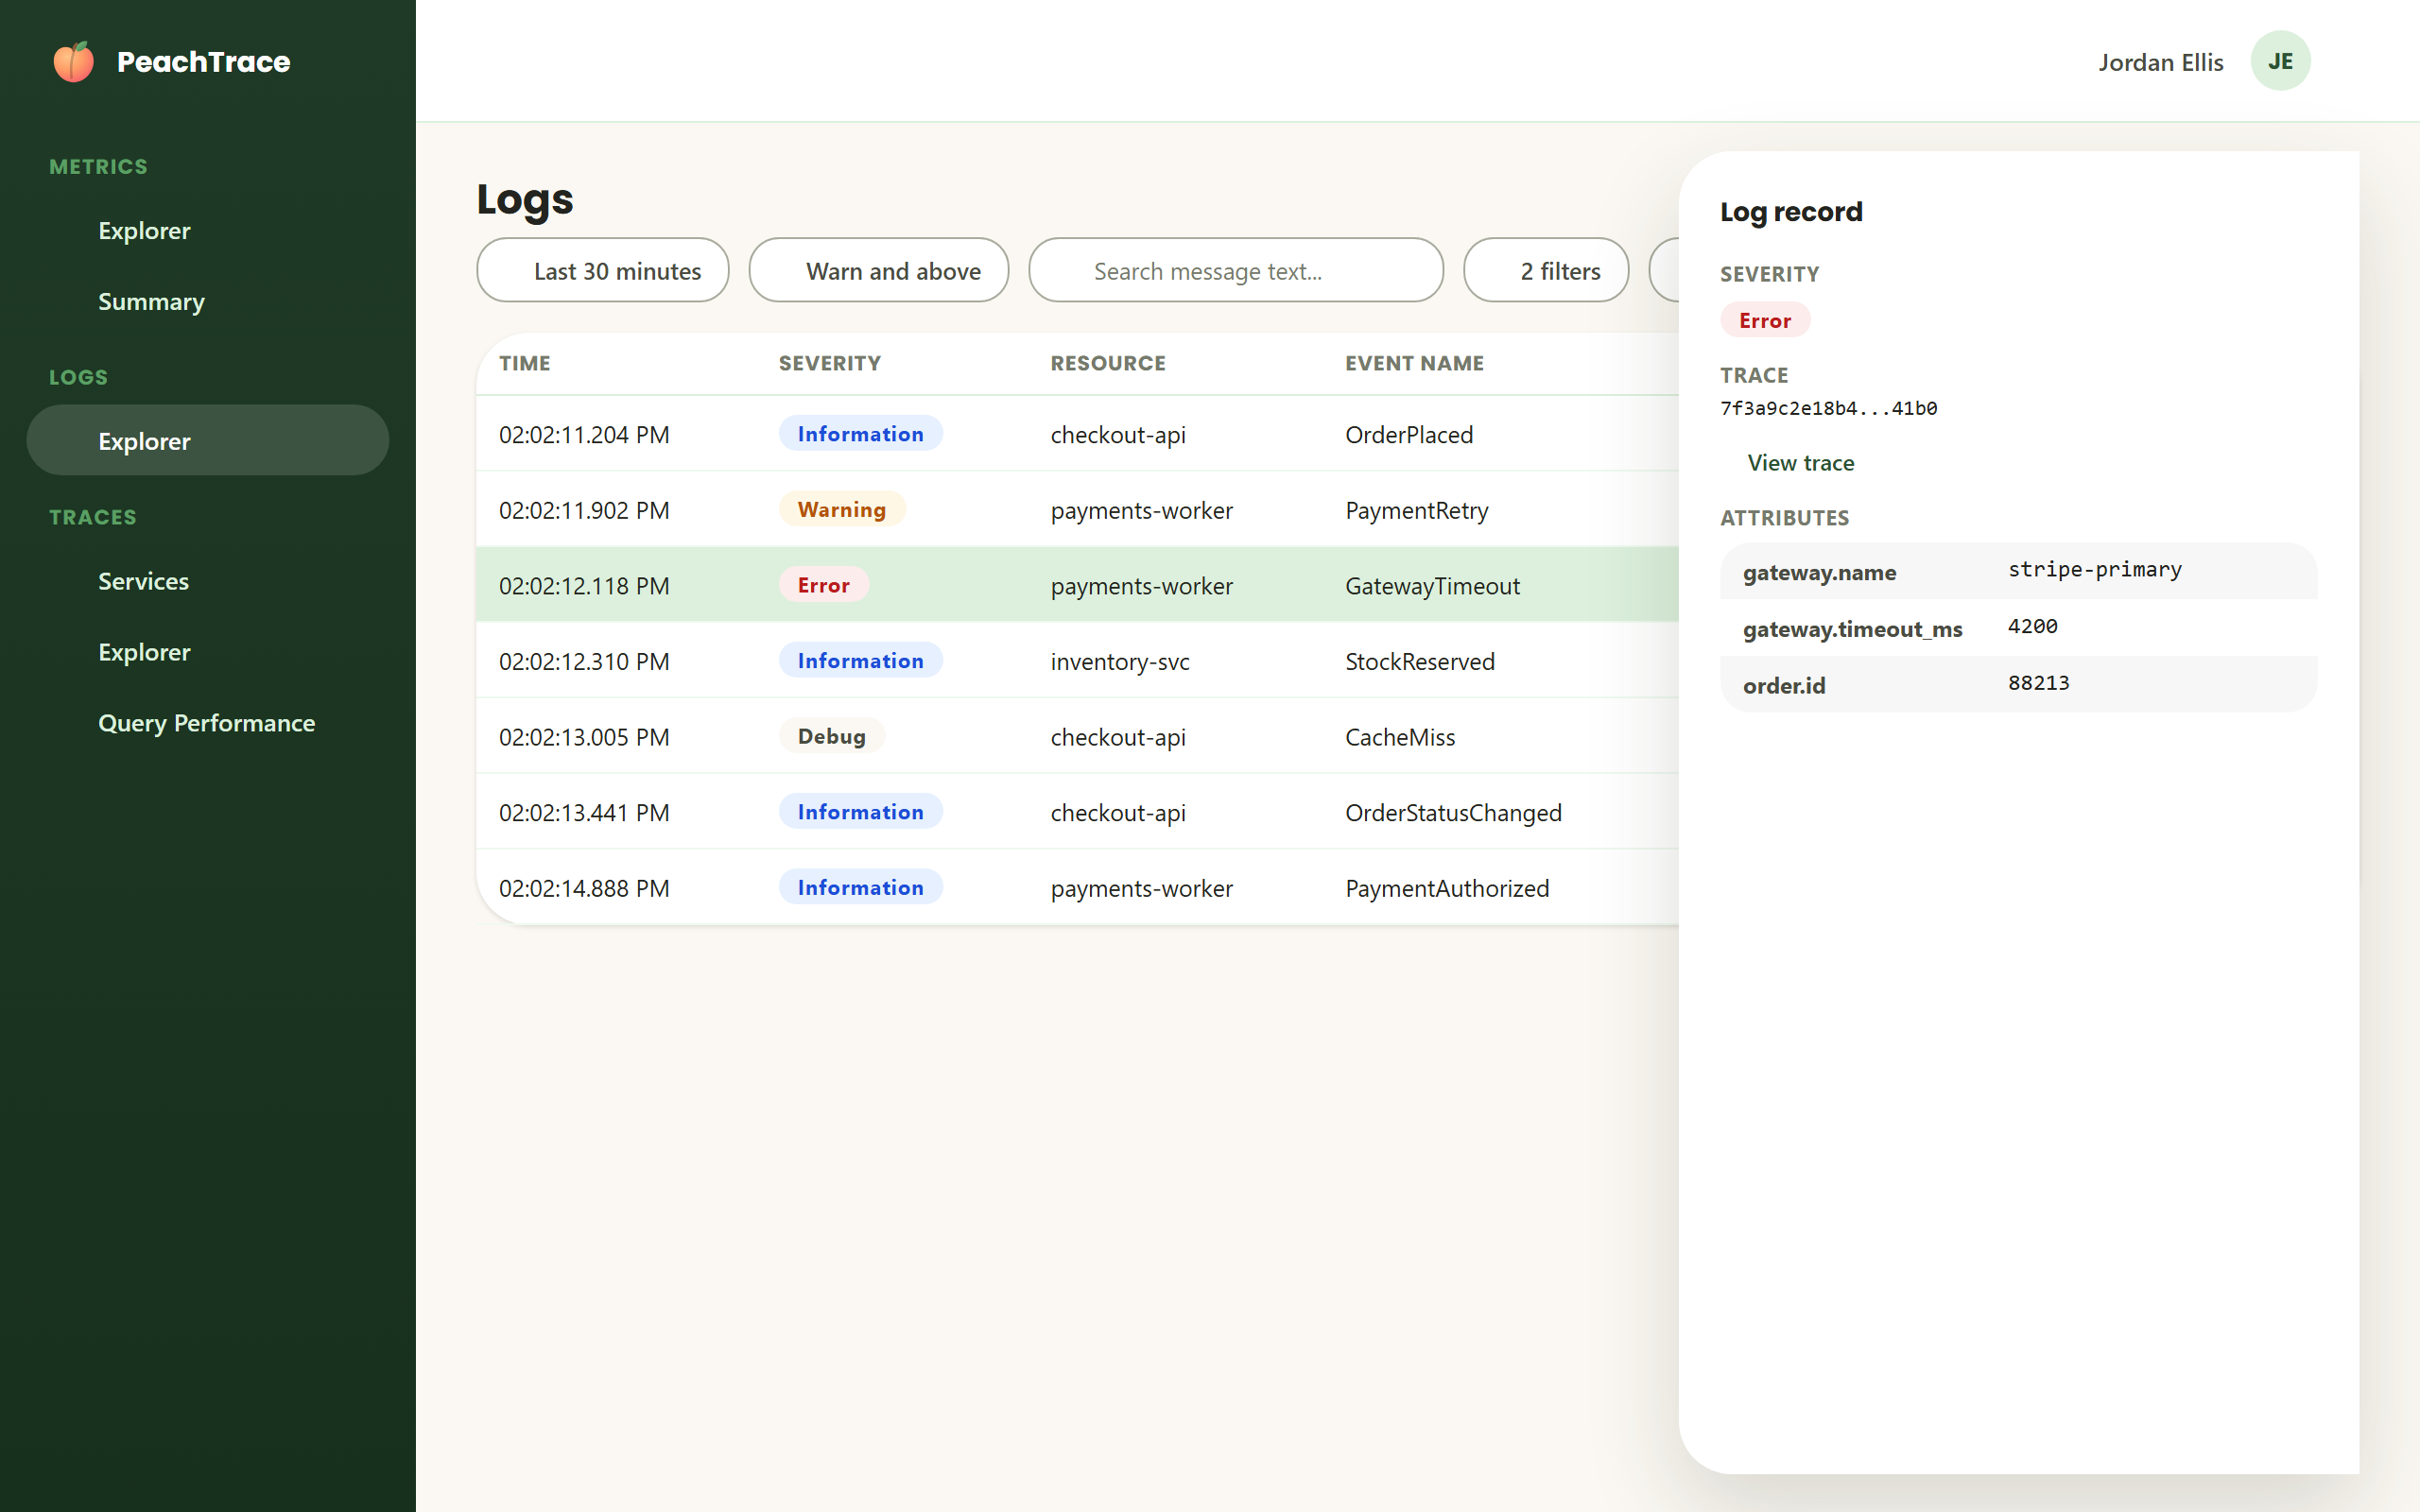
Full OpenTelemetry log fidelity
PeachTrace stores the complete OTel log record: severity number and text, event name, structured body, attributes, and observed timestamp — nothing is flattened or discarded on the way in.
Logs Explorer
- Filter by severity, free-text search across log bodies, or arbitrary attribute key/value filters
- Live Tail — a real-time stream of incoming logs via server-sent events, with resumable cursors so you never lose your place
- Fast, indexed pagination that stays quick regardless of how much history you’re searching
Correlated by design, not by guesswork
Every log record has indexed
trace_id and span_id columns. Click any log line that was emitted inside a trace and you're one hop from the full waterfall — no manual timestamp correlation, no separate correlation ID to wire up yourself.
This is what makes it possible to go from “something’s wrong in this log line” to “here’s the exact request that caused it” in a couple of clicks.
Join the PeachTrace limited beta
We're onboarding a limited number of teams. Tell us about your environment and we'll get you set up.
Join the Beta