Product
Metrics, queried the way you actually think about them
PeachTrace ingests every OTLP metric shape and lets you slice, aggregate, and bucket them without writing a query language.
Full OTLP metric support
PeachTrace stores all four OpenTelemetry metric point types — Number, Histogram, Exponential Histogram, and Summary — along with their aggregation temporality and instrument kind. If your OpenTelemetry SDK emits it, PeachTrace keeps it, scoped to the same resource and service attributes as your logs and traces.
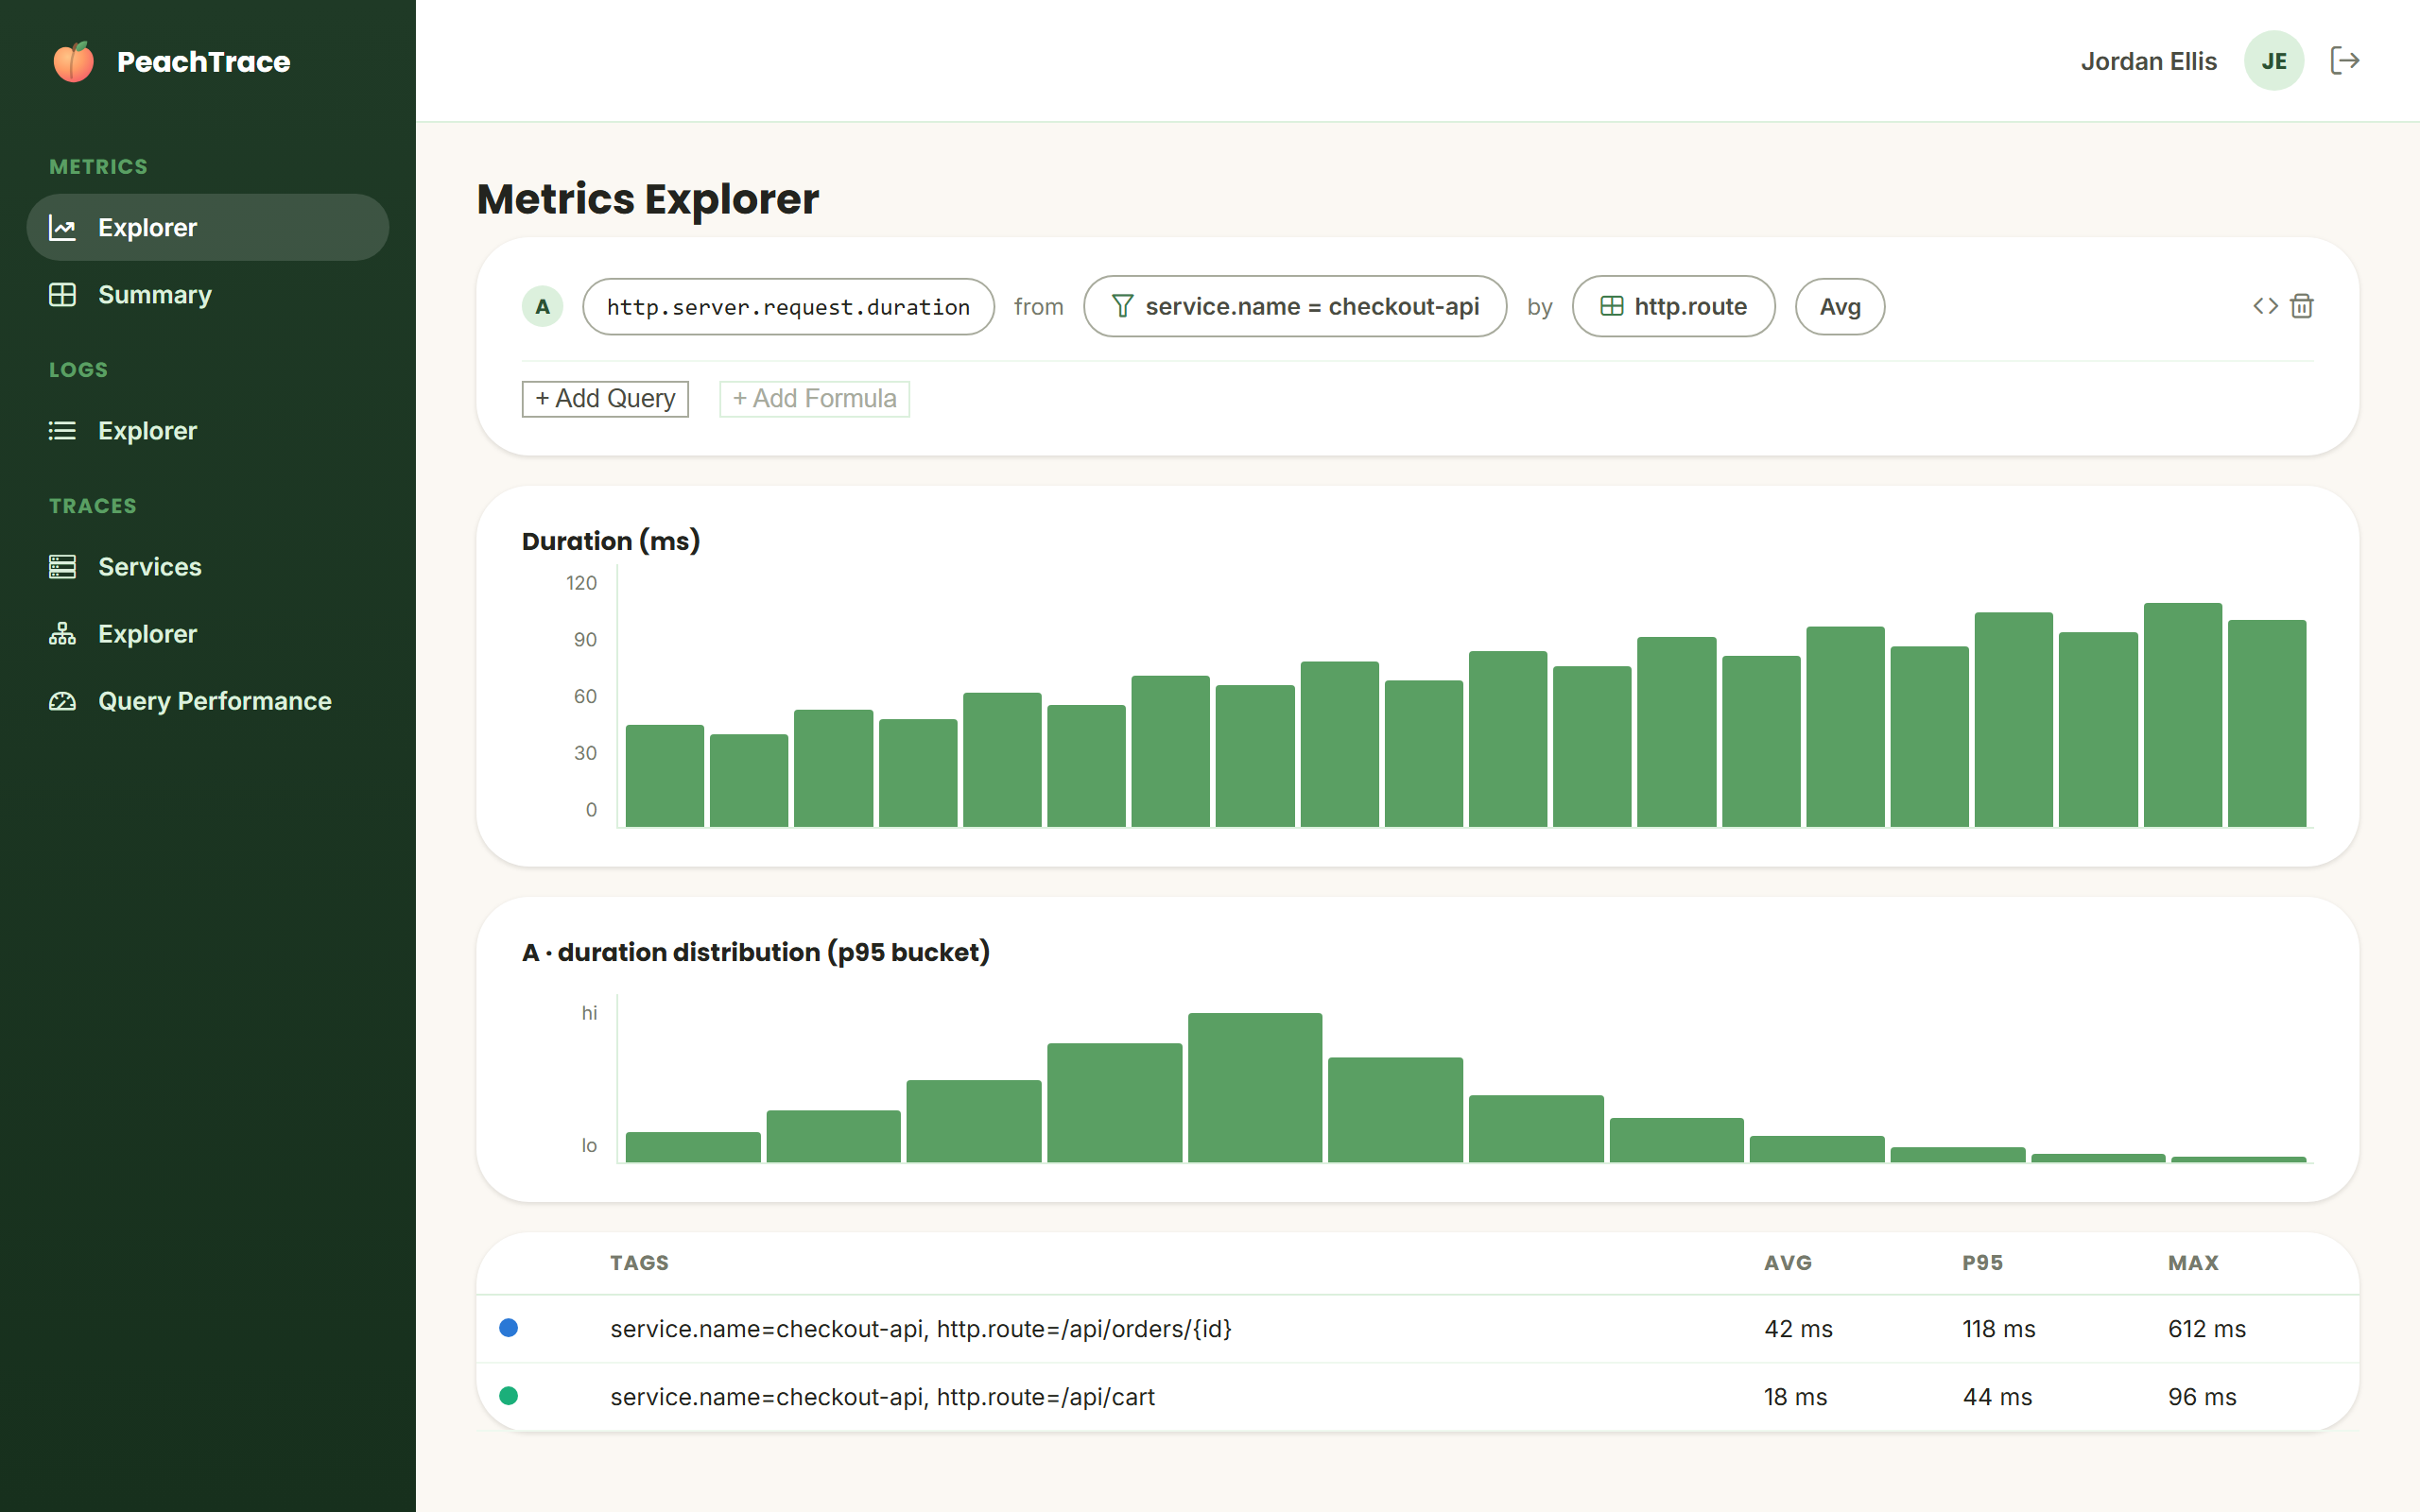
Metrics Explorer
Build ad-hoc queries against your metrics without learning a new query language:
- Up to five aggregations per request — average, min, max, sum, and count
- Time-bucketed results, so a week of data collapses into a readable chart instead of a wall of points
- Group-by on any dimension your metric series carries
- Percentile estimation (p50, p90, p95, p99, or any percentile you need) interpolated directly from histogram buckets, up to five percentiles per request
Metrics Summary
A rolled-up view across every metric series for a service, for when you want the shape of a system at a glance rather than one metric at a time.
Join the PeachTrace limited beta
We're onboarding a limited number of teams. Tell us about your environment and we'll get you set up.
Join the Beta